Background Image

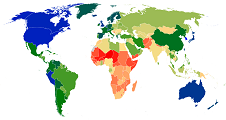
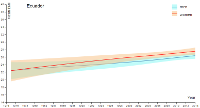
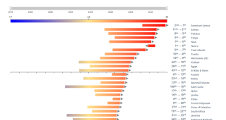
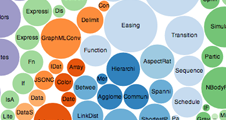
Adult Body-Mass Index - Rural & Urban


Metrics Map Trend
plot
Ranking
plot
Bubble
plot
Distribution
plot
Rural
Mean BMI

(kg/m²)
Image link to world map for rural adult mean body-mass index Image link to line chart for rural adult mean body-mass index for specific countries Image link to ranking chart for rural adult mean body-mass index for all countries Image link to bubble chart for rural adult mean body-mass index and population size for each country in the world, correlated with other factors such as GDP, education, and urbanisation Image link to distribution plot for rural adult mean body-mass index
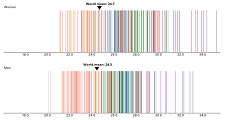
Urban
Mean BMI

(kg/m²)
Image link to world map for urban adult mean body-mass index Image link to line chart for urban adult mean body-mass index for specific countries Image link to ranking chart for urban adult mean body-mass index for all countries Image link to bubble chart for urban adult mean body-mass index and population size for each country in the world, correlated with other factors such as GDP, education, and urbanisation Image link to distribution plot for urban adult mean body-mass index
Urban-Rural BMI Difference
(kg/m²)
Image link to world map for urban-rural adult mean body-mass index difference Image link to line chart for urban-rural adult mean body-mass index difference for specific countries Image link to ranking chart for urban-rural adult mean body-mass index difference for all countries Image link to bubble chart for urban-rural adult mean body-mass index difference and population size for each country in the world, correlated with other factors such as GDP, education, and urbanisation Image link to distribution plot for urban-rural adult mean body-mass index difference