
Hypertension
| Metrics | Map | Trend plot |
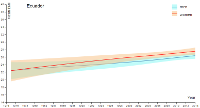
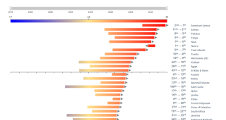
Ranking plot |
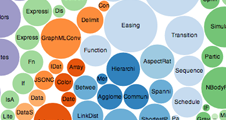
Bubble plot |
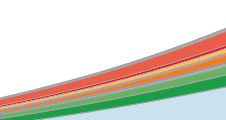
Stacked plot |
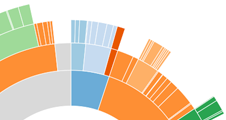
Sunburst plot |
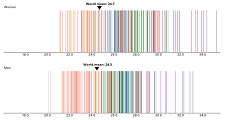
Distribution plot |
|---|---|---|---|---|---|---|---|
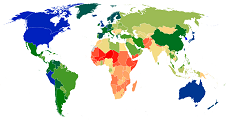
| Hypertension (SBP ≥ 140 mmHg or DBP ≥ 90 mmHg or taking medication for hypertension) |
 |
 |
 |
 |
 |
 |
 |
| Hypertension diagnosis/detection (among all hypertension) |
|
|
|
|
|
||
| Hypertension treatment (among all hypertension) |
|
|
|
|
|
||
| Hypertension control (among all hypertension) |
|
|
|
|
|
||
| Untreated stage 2 hypertension (among all hypertension) |
|
|
|
|
|