
Diabetes
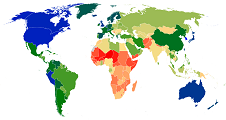
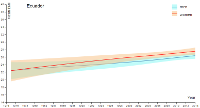
| Metrics | Map | Trend plot |
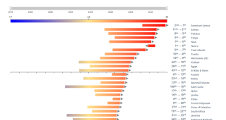
Ranking plot |
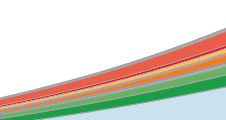
Stacked plot |
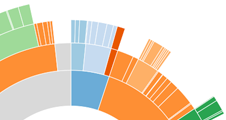
Sunburst plot |
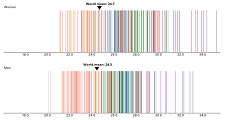
Distribution plot |
|---|---|---|---|---|---|---|
| Diabetes (fasting plasma glucose ≥ 7.0 mmol/L or HbA1c ≥ 6.5% or taking medication for diabetes) |
 |
 |
 |
 |
 |
 |
| Diabetes treatment (among all diabetes) |
|
|
|
|
||
| Untreated diabetes | |
|