
Cholesterol
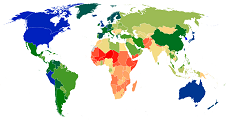
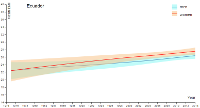
| Metrics | Map | Trend plot |
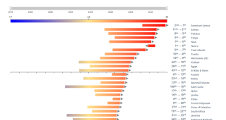
Ranking plot |
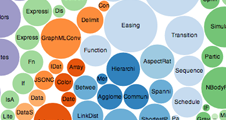
Bubble plot |
Distribution plot |
|---|---|---|---|---|---|
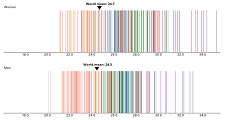
| Mean total cholesterol (mmol/L) |
 |
 |
 |
 |
 |
| Mean HDL cholesterol (mmol/L) |
|
|
|
|
|
| Mean non-HDL cholesterol (mmol/L) |
|
|
|
|
|